

This Audio above is a Podcast style, AI Audio Overview of the Article you will be reading, it is not a line by line narration, but rather more content for you to enjoy!
The September Consumer Price Index (CPI) report was released this morning, and on the surface, Wall Street is breathing a sigh of relief. The headline Overall CPI number shows inflation undershooting expectations and coming in at 3.0% year-over-year, with the critical Core CPI (which excludes food and energy) matching it at 3.0%.
In Washington and New York, this is being painted as a victory.
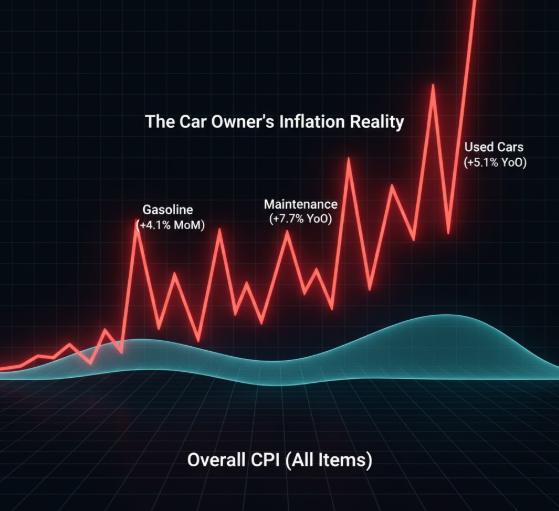
But here in Daytona Beach, we know that the “average” basket of goods is a statistical mirage. For the average American household, the real cost of living is dictated by the non-negotiable items they buy every day. And this CPI report confirms a painful, data-driven reality: the cost of owning and operating a vehicle continues to climb relentlessly, far outpacing the celebrated headline number.
This isn’t a victory. This is a confirmation that “The Great Squeeze“ on the American car owner is tightening. The headline numbers are a mask, and today we are pulling that mask off to show the reality underneath.
Deconstructing the Automotive Pain Points
The core of the story is found by ignoring the headline and looking at the specific data for car owners. When you isolate the automotive components, a picture of intense financial pressure emerges. Here are the numbers that matter.
Table 1:
Overall Inflation Snapshot
(September 2025)
| Metric | Month-over-Month | Year-over-Year |
| Overall CPI | +0.3% | +3.0% |
| Core CPI (Excl. Food & Energy) | +0.2% | +3.0% |

Start Your Research Here
The ‘A’ in A.S.M.R. is for Automotive. This is your toolkit for becoming a smarter buyer.
Table 2:
Key Automotive CPI Components
(September 2025)
| Category | Index Value | Month-over-Month | Year-over-Year |
| New Vehicles | 178.510 | +0.2% | +0.8% |
| Used Cars & Trucks | 184.568 | -0.4% | +5.1% |
| Motor Vehicle Insurance | 890.473 | -0.4% | +3.1% |
| Maint. & Repairs | 442.843 | +0.2% | +7.7% |
| Gasoline (All Types) | 285.595 | +4.1% | -0.5% |
Source: U.S. Bureau of Labor Statistics
Let’s analyze this data with the sharp, focused lens of an industry professional.
At first glance, you might see small pockets of relief. Used Cars & Trucks dipped 0.4% from last month, and Motor Vehicle Insurance saw a tiny 0.4% monthly decline. But this is statistical noise, not meaningful relief. Insurance is still up a painful 3.1% year-over-year, and used vehicles are up a significant 5.1%.
The real story—the one that households feel as a gut punch—is in the two most unavoidable costs.
First, Gasoline prices exploded in September, jumping 4.1% in a single month. While the year-over-year number is slightly down, families don’t pay for gas “year-over-year”; they pay for it right now. A 4.1% monthly spike is a direct drain on household cash flow.
Second, and most alarming of all, is Motor Vehicle Maintenance & Repairs. This category is the grim reaper of car ownership, and it continues its relentless, crushing climb, rising another 0.2% in September but soaring by a massive 7.7% over the last year. This is the “relentless” component we’ve been warning about.
Why This Is “The Great Squeeze“

This is where we connect the data to the narrative. “The Great Squeeze” is defined by the inescapable costs of living rising far faster than average inflation, forcing consumers to make impossible choices. This CPI report is the smoking gun that proves it’s happening.
The government is celebrating a 3.0% inflation rate. But that’s meaningless when:
- Keeping your car on the road (Maintenance & Repairs) is inflating at 7.7%.
- The value of the used car you need to buy is still 5.1% higher than last year.
- The insurance for that car is 3.1% more expensive.
- The gas you needed to buy last month saw a 4.1% price hike.
The essential, non-negotiable costs of car ownership are all dramatically outpacing the “average” basket of goods. This is the precise financial pressure that is crushing the American consumer. A small dip in the monthly cost of a used car doesn’t matter when the cost of a single repair can wipe out a month’s savings. This is the squeeze in action.

Own It Right.
The ‘M’ is for Maintenance. Find your vehicle’s official factory service schedule.
The Story Behind the Numbers:
Connecting the Dots

This CPI data does not exist in a vacuum. It is the cause of the devastating effects we have been investigating for weeks.
When you see that repair costs are up 7.7%, you are seeing the “why” behind the collapse of subprime auto lenders and parts conglomerates. This is the financial shock that pushes a subprime borrower into default. It’s this exact pressure that broke the business models of Tricolor, First Brands and Primalend. Those companies weren’t just victims of alleged fraud or bad management; they were victims of a consumer base that simply ran out of money.
When you see New Vehicles still ticking up while consumers are being squeezed by gas and repairs, you understand the tension we saw in GM’s earnings report. The high-margin trucks and SUVs that form the bedrock of their profits are becoming an untenable luxury for a consumer who can’t even afford a 7.7% spike in repair bills.
This data provides the macroeconomic proof for the microeconomic crises we are seeing on the ground. The story is consistent: the consumer is being financially suffocated by the very vehicle they depend on to live.

No Easy Road Ahead

Do not be fooled by the celebratory headlines over a 3.0% inflation number. For the American car owner, the data is clear: the most painful and essential costs of driving continue to be a primary source of financial burden.
This report confirms that “The Great Squeeze” is not a temporary anomaly; it is the persistent, grinding reality for millions of households. The cost of simply owning and operating a vehicle is a major driver of financial stress, and that stress is now visibly breaking the weakest links in the automotive finance chain.
This data provides the critical, sobering context for the rest of the industry’s earnings season. With this much pressure on the consumer, the road ahead for automakers and lenders looks anything but easy.

Based in Daytona Beach, Florida, Josh Logan provides data-driven analysis from the unique perspective of a seasoned automotive professional. His goal is to empower consumers with insider knowledge to navigate the complexities of the modern car market.

I appreciate you reading this, and encourage you to engage with me in the comments and on social media. You can get the latest automotive updates as soon as they are published by subscribing above. Thanks for the support, and until next time!


Leave a comment