
This morning, the U.S. Bureau of Labor Statistics released the highly anticipated Consumer Price Index (CPI) report for July, showing headline inflation rose by 0.3% for the month and 2.7% over the last year.
That’s the big-picture number you’ll see in the headlines, and it’s where the national political debate will live. But for our purposes, that’s all it is—a headline.
We’re here to talk about cars. My job is to dig deeper and analyze the specific data that directly impacts the cost of owning and operating a vehicle. Let’s get to the real deal: the automotive inflation numbers.
This morning’s Consumer Price Index (CPI) report delivered a harsh reversal for American car buyers and owners. After several months of cooling prices that offered a glimmer of hope, auto-related inflation surged in July, driven by a stunning rebound in the used car market and a relentless, re-accelerating climb in insurance costs.
The Automotive CPI Deep Dive: The July Reversal
Here are the critical, seasonally adjusted numbers for our space, based on the official BLS report. This is the data that truly matters.
| Automotive Category | July ’25 vs. June ’25 (Month-Over-Month) | July ’25 vs. July ’24 (Year-Over-Year) | 90-Day Trend (May-July) |
| New Vehicles | 0.0% | ▲ +0.4% | Stabilized / No Longer Falling |
| Used Cars & Trucks | ▲ +0.5% | ▲ +4.8% | Sharp Reversal to Inflation |
| Motor Vehicle Insurance | ▲ +0.1% | ▲ +5.3% | Re-Accelerating Increase |
| Maint. & Repairs | ▲ +1.0% | ▲ +6.5% | Strong, Steady Increase |
Source: U.S. Bureau of Labor Statistics (BLS), CPI Report released August 12, 2025.

Analysis: The Four Key Takeaways for Car Owners
This data signals a perfect storm of rising costs. Here’s the breakdown.
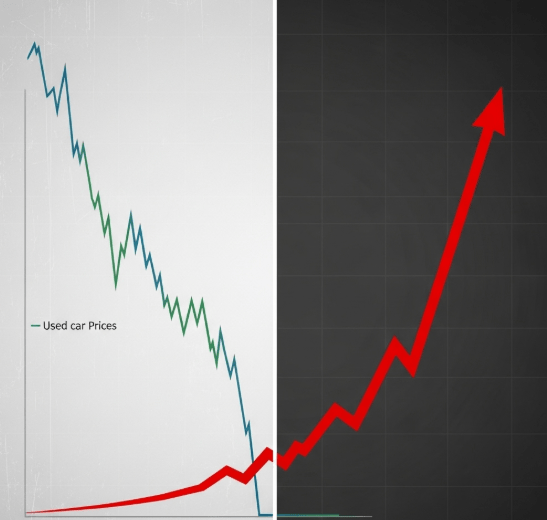
1. The Used Car Price Reversal is the Top Story. After four consecutive months of price drops that provided much-needed relief, the used car market snapped back with a +0.5% increase in July. This is a major blow to buyers on a budget and suggests the floor has been found. The brief window of a softening used car market appears to be closed, with year-over-year prices now up a painful 4.8%.
2. The Insurance Nightmare Continues and Re-accelerates. There is no relief here. After a brief slowdown in cost increases last month, motor vehicle insurance hikes came roaring back, jumping 0.1% in July alone. The year-over-year number is an astonishing +5.3%, continuing its reign as one of the most significant and painful drivers of inflation for American families, with a 56% increase since 2020 in the Motor Vehicle Insurance Index.
3. New Vehicle Prices Have Stopped Falling. The trend of slight price drops for new cars is over. A flat 0.0% for July indicates that with used car prices rising again, automakers feel no pressure to discount. This ends any narrative of a “buyer’s market” developing and adds to the affordability crisis.
4. The “Cost of Keeping It” is a One-Way Street: Up. The cost for Maintenance and Repairs continues its relentless march upward, climbing another 1.0% in July. With year-over-year costs up 6.5%, it’s clear that from the insurance premium to the mechanic’s bill, every aspect of simply maintaining a vehicle is becoming significantly more expensive.

The Overall Picture
The July CPI data is an unambiguous negative for the American consumer. The brief period of relief from falling vehicle prices is over, replaced by a fresh wave of inflation in the used car market. This, combined with the brutal and re-accelerating costs of insurance and repairs, signals that the total cost of automotive ownership is firmly on the rise, putting even more stress on household budgets.

I appreciate you reading this, and encourage you to engage with me in the comments and on social media. You can get the latest automotive updates as soon as they are published by subscribing above. Thanks for the support, and until next time!


Leave a reply to TheLoganZone Insider Report: August 2025 – TheLoganZone Cancel reply