

This Audio above is a Podcast style, AI Audio Overview of the Article you will be reading, it is not a line by line narration, but rather more content for you to enjoy!
The numbers are in, and they paint a picture of a market dangerously at odds with itself. The September Manheim Used Vehicle Value Index (MUVVI) was released this morning, and the headline figure is frankly stunning in its stability. In a market where every sign on the retail front points to a consumer pullback, weakening demand, and growing new inventories, wholesale vehicle values at auction remained virtually frozen, declining a mere 0.2% from August.
This isn’t the significant correction many dealers—and consumers—have been waiting for. This is a story of a wholesale market that is stubbornly refusing to reflect the reality unfolding on dealership lots across the country. The index stands at 207.0, a figure that is still up 2.0% year-over-year and 2.4% since the start of the year.
This great disconnect, the growing chasm between the price dealers must pay for inventory and what consumers are able or willing to pay for it, is the next chapter in the “Great Squeeze” we’ve been documenting for months. It’s creating a high-risk environment for dealers and delaying any meaningful price relief for the end consumer. The tension is palpable, and the data shows why.

Based in Daytona Beach, Florida, Josh Logan provides data-driven analysis from the unique perspective of a seasoned automotive professional. His goal is to empower consumers with insider knowledge to navigate the complexities of the modern car market.
Deconstructing the Index
A Story of Minor Moves

At first glance, a 0.2% dip seems insignificant. But unpacking the numbers within the index reveals a market being pulled in multiple directions at once, with clear winners and losers emerging. The data shows a complex battlefield, not a simple retreat.
Here is the top-line data that forms the foundation of our analysis:
| Metric | Sept 2025 Index Value | Aug 2025 Index Value | Key Insight |
| MUVVI Value | 207.0 (+2.0% YoY) | 207.4 (+1.7% YoY) | “Prices are stubbornly high, defying retail slowdown.” |
| Luxury | +3.0% | +2.3% | The strongest performing segment year-over-year. |
| Compact Cars | -6.5% | -3.5% | “The weakest segment, getting hit the hardest by affordability issues.” |
| Midsize Cars | -0.6% | -2.0% | “The car segments in general are both down as seen over the last decade.” |
| Pickup Trucks | -0.3% | -0.3% | “Continuing Negative year-over-year, a key warning sign.” |
| S.U.V.s / C.U.V.s | +0.7% | +1.3% | “This is the most popular segment in total sales with slight elevation” |
| EVs | +6.4% | +4.6% | “A surprising monthly gain, likely due to the tax credit rush.” |
| Non-EVs | +1.0% | +1.4% | “Seeing Non-EVs elevation like this shows it isn’t just an EV tax mirage” |
Source: Manheim / Cox Automotive (October 7, 2025 Release)

Start Your Research Here
The ‘A’ in A.S.M.R. is for Automotive. This is your toolkit for becoming a smarter buyer.
The story here is one of divergence. On one hand, you have clear pockets of strength. Luxury vehicles continue to show robust year-over-year gains, proving the high-end consumer is still insulated from the broader market pressures. Even more surprising is the pop in EV values, which saw a 6.4% year-over-year increase. As Manheim’s own analysts noted, this is almost certainly a “pull-forward” effect, with buyers rushing to capture expiring tax credits before they disappear. The question remains how this artificial inflation will impact the segment, and the overall index, when that demand cliff arrives.
On the other hand, the warning signs are flashing bright red. For the second month in a row, the once-invincible pickup truck segment is officially negative year-over-year. This is a critical indicator, as trucks have been the bedrock of dealer profits for years. Their decline signals a fundamental crack in the market’s foundation.
Even more troubling is the outright freefall of compact cars, down a staggering 6.5% year-over-year. These vehicles are the canaries in the coal mine for affordability. When the most budget-friendly options on the market are seeing their values collapse, it tells you everything you need to know about the financial health of the average American car buyer.

Own It Right.
The ‘M’ is for Maintenance. Find your vehicle’s official factory service schedule.
The Seller’s Market
Why Aren’t Prices Crashing?

This brings us to the central question: if retail demand is so weak, why are wholesale prices in “The Box” staying so high? The answer lies on the supply side of the equation. Sellers—primarily large fleet companies, rental agencies, and dealer groups—are not panicking. They are holding the line on prices because, for now, they can.
Manheim’s data provides two crucial data points that explain this phenomenon:
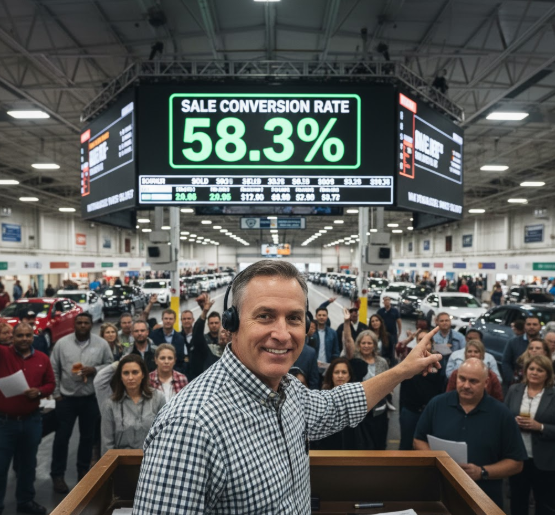
- High Conversion Rates: The sales conversion rate at auction—the percentage of vehicles that actually sell versus just run through the lane—was 58.3% in September. This is a historically strong figure. It means that when a seller puts a car up for auction, there’s a very high probability it will sell at or near the desired price. Dealers are still bidding, and sellers are not being forced to capitulate on price to move metal.
- Lower-Than-Normal Depreciation: Digging deeper into the non-seasonally adjusted data, Manheim revealed that prices in the first half of September actually increased slightly. This is contrary to normal historical depreciation patterns for this time of year. In short, vehicles are still holding their value better than they typically would, giving sellers immense confidence to hold their floor prices high.
The conclusion is clear: the supply side of the wholesale market has not yet been forced to react to the profound weakness on the demand side of the retail market. Sellers are getting the prices they want, and dealers who desperately need inventory are being forced to pay up.

A Powder Keg for Dealers
This disconnect between wholesale strength and retail weakness is creating a powder keg for the average dealership. They are caught in a classic margin squeeze, forced to pay near-record high prices at auction for inventory that they will now struggle to sell at retail without taking a significant loss. Every day a vehicle sits on a lot, its value depreciates, and the cost of carrying that inventory (known as “floorplan”) eats into an already thinning margin.
This MUVVI report directly validates the stark warnings we heard from the recent CarMax earnings call, where they detailed the severe margin compression they were already experiencing. The data confirms this is not an isolated problem; it is a market-wide condition.
For weeks, we have been analyzing the slow, grinding pressure on the auto industry. This report confirms that the pressure is now reaching a critical stage. The wholesale market is holding its breath, creating a dangerous standoff with a weakening retail reality. Tomorrow, we’ll reveal what Manheim’s leadership said when we asked about repossessions—a key factor that could break this standoff. And on Thursday, we’ll detail the inventory that is already piling up on dealer lots, a story told by the data on Days’ Supply. The saga continues.

I appreciate you reading this, and encourage you to engage with me in the comments and on social media. You can get the latest automotive updates as soon as they are published by subscribing above. Thanks for the support, and until next time!


Leave a comment